
We use models all the time to represent things in the real world. A globe or a map is a model. Diagrams are models. Your sat nav is a model – a simulation of you, your car and your journey.
“All models are wrong, but some are useful”.
George Box
Models are simplifications of the real world. They are not accurate representations of reality. If fact, if they were, they would be useless. The point of them is that they simplify reality and make it easier to understand.
The London underground map is a brilliant piece of design and great model – it helps us navigate effectively through a busy transport system. But it not accurate – the Thames does not follow a straight line. And it is not drawn to a consistent scale – stations at the periphery of London have been placed closer together to avoid making the map unnecessarily large. The underground map serves a function – to help us navigate. It does not pretend to be accurate. It’s ‘wrong’ but very useful. And if it were more right (more accurate), it would be less useful!
Agent Based Models
An agent is an autonomous individual element in a computer simulation. Agent based modelling (ABM) is used to simulate or model interactions between agents and their environments. This can be ‘agent to agent’ or ‘agent to environment’. Agent based models are used to describe, explore and understand complex systems that we see around us. They can be ways of illustrating concepts or experimenting with ideas. They are ways of playing around with complex systems. But most of all, they are fun! In a geeky kind of way…
“The geeks shall inherit the earth!”
Agents don’t have to be people, although they can be. Agents can be other living organisms (plants, animals or viruses), organisations (businesses or governments) or environmental elements (infra-red rays, sunshine, CO2, rainfall, fire). Any element that interacts with other elements is an agent.
The agents in the model will act according to certain rules or parameters that you set. This means you can run the model many times and get different results.
How do you make an Agent Based Model?
If you want to make an ABM, you can do it the hard way or the easy way. The hard way is starting from scratch and doing all the coding yourself like a good computer nerd. The easy way to use a toolkit where someone else has already done much of the work for you.
Still unsure which way to choose…?
Let me tell you: I’m going to choose the easy way… So that after creating my model, I will still have ample time to kick back and relax…

NetLogo
One of the most popular ABM toolkits is NetLogo because it’s open source and easy to use. It’s accessible but at the same time can be used to create high end complex models. Its use underpins many peer-reviewed academic papers. It’s also easy to share and collaborate on models so they can be developed.
What’s a Turtle?

I’m sure you know what this kind of turtle is… but there are things called ‘turtles’ in NetLogo. So what on earth are they and why are they called turtles?
NetLogo was developed in about 1969 by Seymour Papert and colleagues. Papert used the language logo to enable an agent to be moved in a virtual way. When he went into schools to teach children about programming, he took a physical robot which he called a ‘turtle’… although it looks more like a very big yellow motorcycle helmet on wheels.
Library of Models
One of the cool things about NetLogo is that it comes preloaded with a library of models for you to play around with. This is a great way to learn and experiment. You can access the code for each of the models, so it’s like being able to get at the engine of your car and have a tinker.
Here are two of the models you can play around with. These are very famous models which help illustrate key points in systems thinking.
The Fire Model
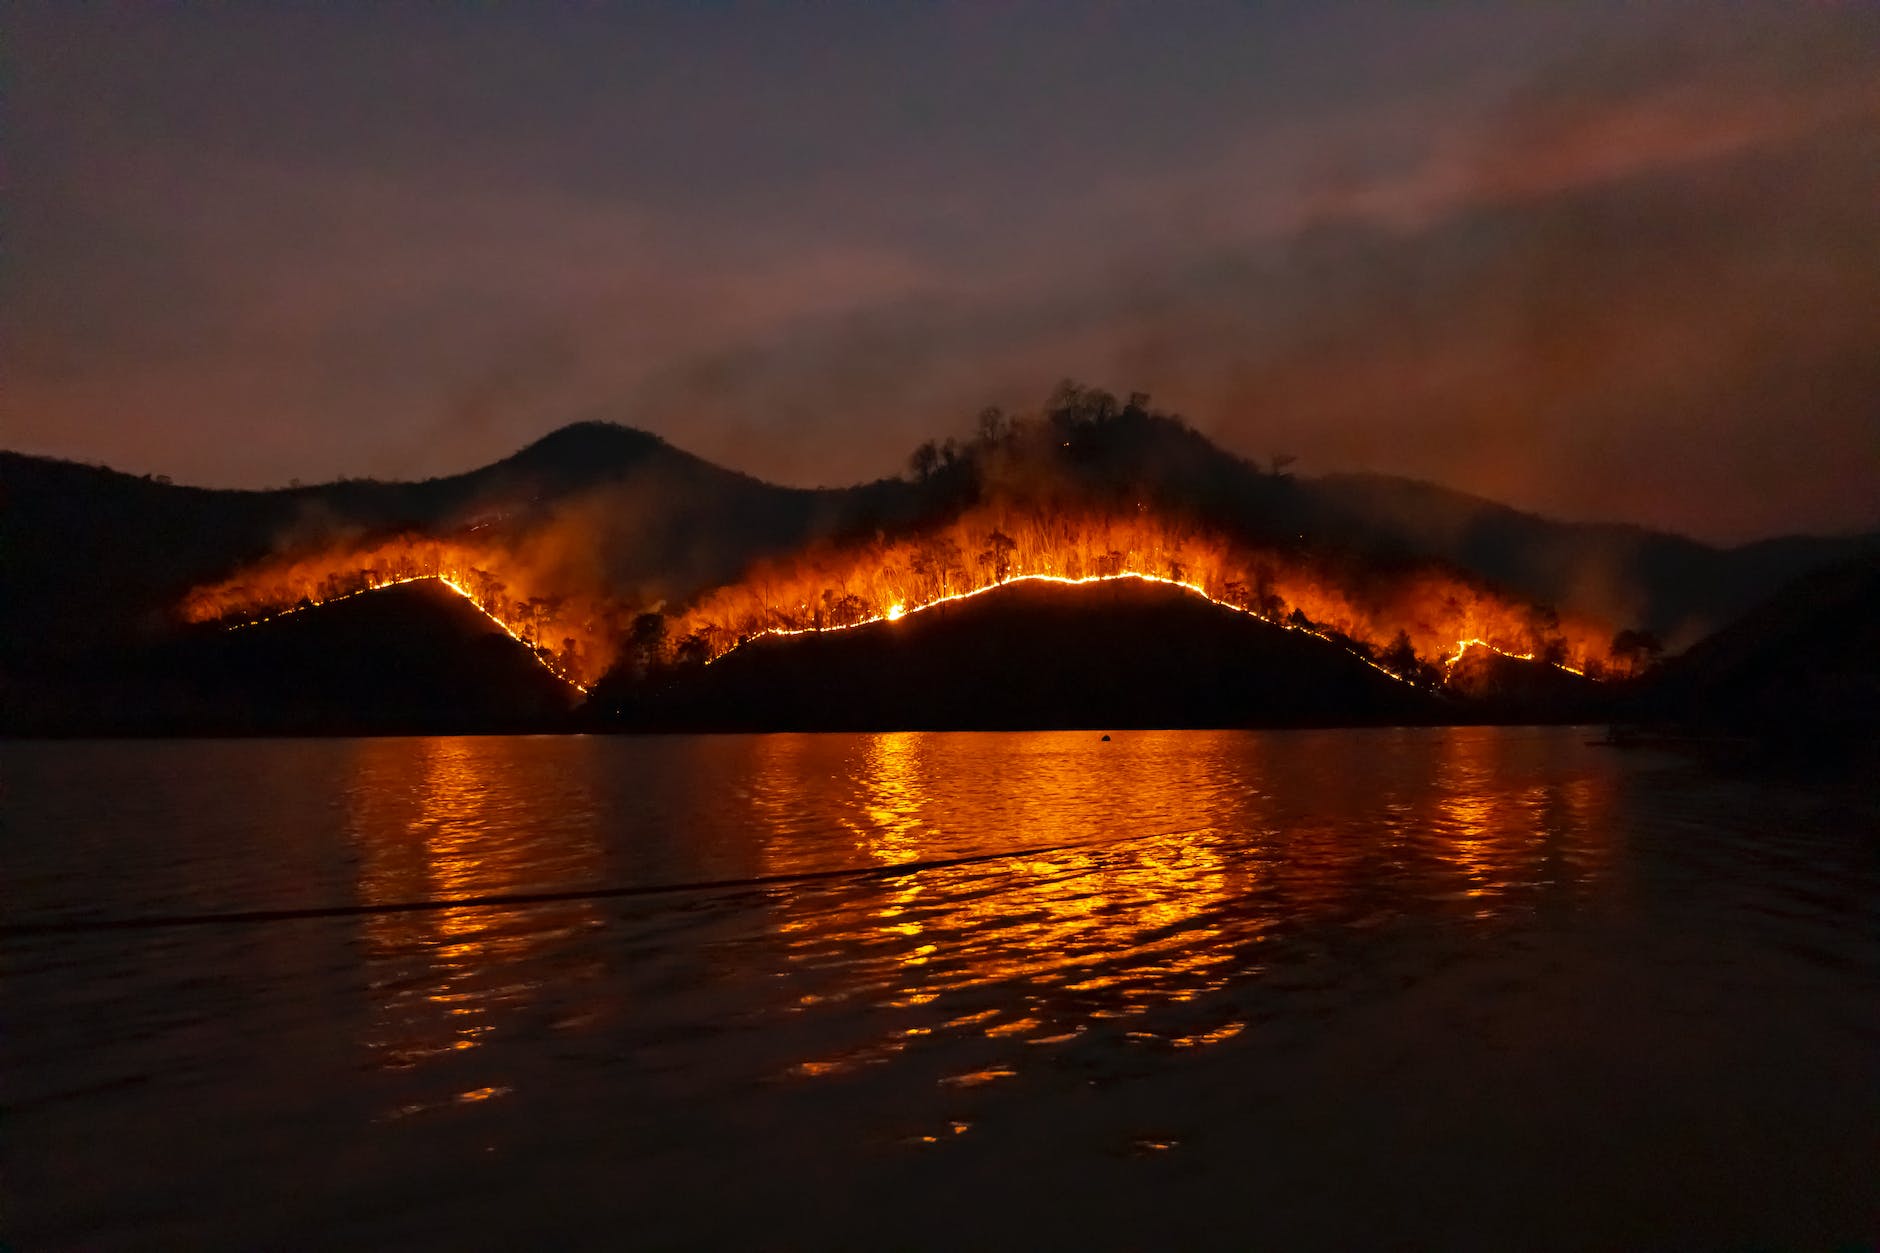
The fire model illustrates how fire spreads through a forest. The user can increase or decrease the percentage of tree density through adjusting a slider and can then see how this impacts the percentage of trees burned and whether the fire makes it across the ‘world’ from one side of the forest (or screen) to the other.
Fire can only spread to neighbouring trees – the model assumes there is no wind and so cannot skip over unwooded areas. The fire can spread in all directions – north, east, south and west.
Each time the simulation is run, the trees are randomly placed in the space according to tree density, so the pattern of the fire is different each time. The focus of the simulation is the relationship between the percentage of trees burned and the tree density – the spread of the fire.
The model demonstrates how a small change in the input parameter (tree density) can have a large impact on the output of the system (how the fire spreads). The fire’s chance of reaching the right edge of the forest depends on the density of trees. This demonstrates a common feature of a complex system – there is a non-linear threshold or critical parameter.
You can find out more about thresholds and tipping points in this post – Tipping Points – Key Concepts.
Schelling’s Tipping Model

This model was published in 1972 by the economist Thomas Schelling who later went on to win the Nobel Prize in Economic Science in 2005. The model explores the conditions that lead to racial segregation in communities.
In this model, there are two types of agents represented by different coloured dots. The agents are people or households of different races. In the model, each agent wants to live near one of ‘its own’. Individual preferences ripple through the neighbourhood, leading to large-scale patterns and changes to the system as a whole.
The model has a very simple rule at its heart. As long as 30% of the people around you are similar to you, then you are happy and you don’t want to change location. However, if fewer than 30% of your neighbours are like you, then you are unhappy and you want to move.
Someone that is happy if up to 70% of their neighbours are of a different race does not seem racist. This position is very different from people refusing to live next to someone who is of a different race. Yet, even under these conditions, the neighbourhoods quickly become segregated. A small bias creates a large scale change in the system. This is a great example of unintended consequences: individual agents acting in a way that has unexpected and perhaps undesirable consequences for the system as a whole.
References
Wilensky, U. (1997). NetLogo Fire model. http://ccl.northwestern.edu/netlogo/models/Fire. Center for Connected Learning and Computer-Based Modeling, Northwestern University, Evanston, IL.

Leave a comment